![]()
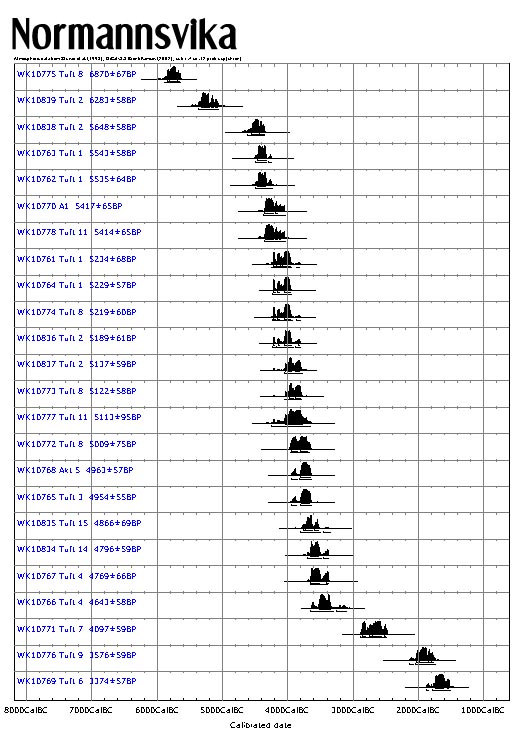
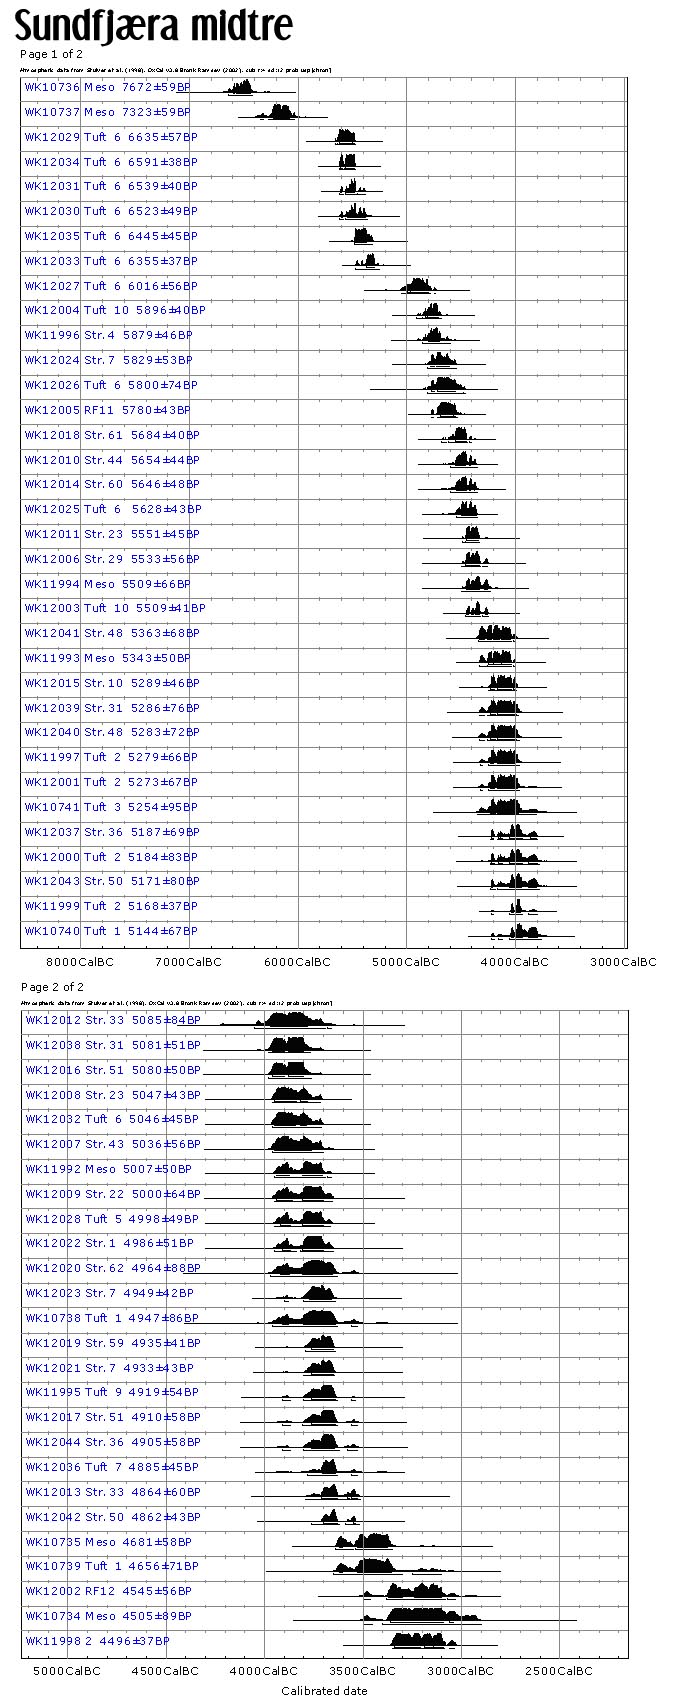
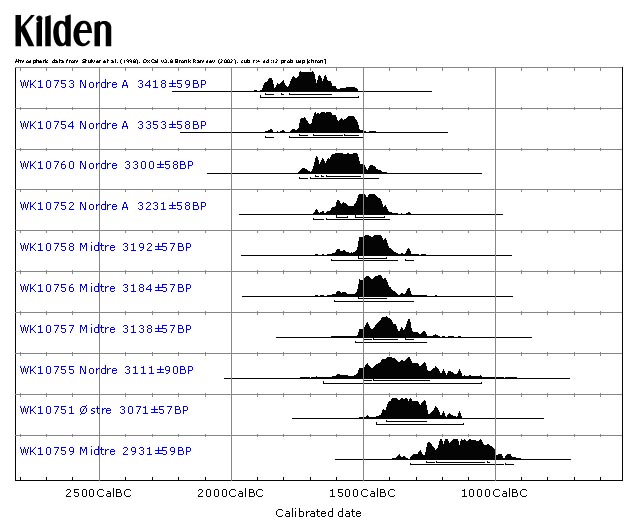
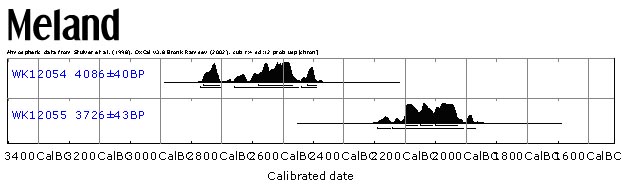
The diagrams are made with the calibration software Oxcal. This is developed to calibrate C-14 dates to calender years. More about the reason for why datings must be calibrated can be found here.
The text in blue at the left side of the diagrams on the following pages shows the code given the dating from the laboratory, which structure the sample is taken from, and the C-14 date, recognised by the ± and BP (Before Present).
At the bottow of the diagram are normal calender years given.
The histograms show which years the samples most probably are from. It is more likely the sample's age lies within the areas where the histograms are more marked. Below each histogram two rows of lines can be seen. The lower represents 2 sigmas, and it is 96% probability for the sample's age to lie within the years represented by this line.The upper line represent 1 sigma, and there is 68% probability for the age to lie within this line.
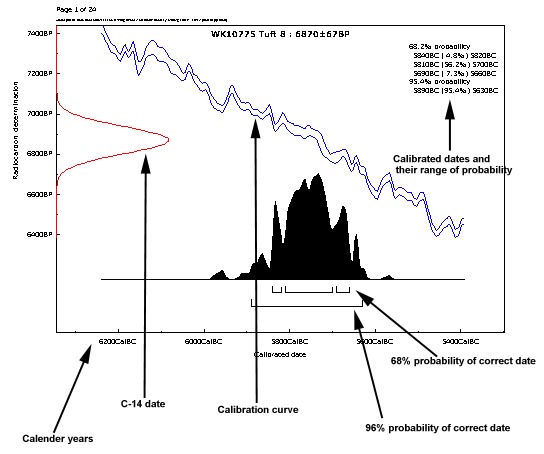
Above: a typical result of a calibration performed by Oxcal